


Statistics
Statistics
Fiscal Year (FY) 2025 in Review
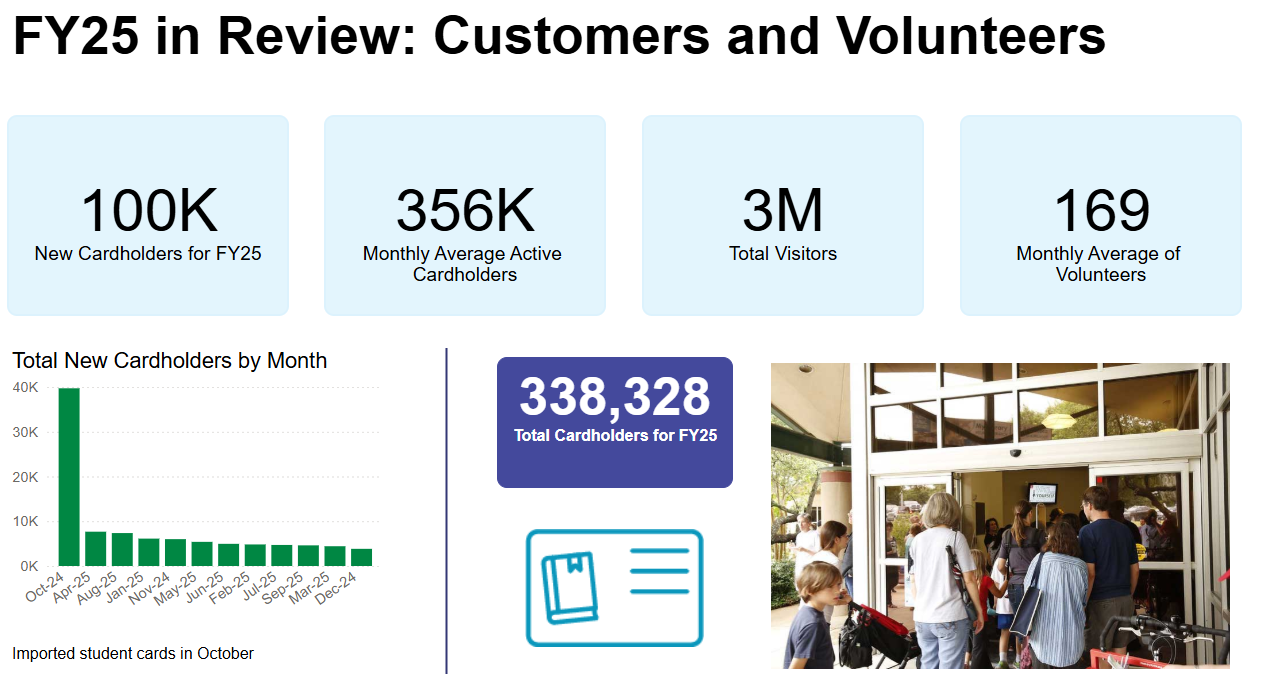
- Customers and Volunteers
- 100,000 new cardholders for FY25
- 346,000 average active cardholders each month
- 3,000,000 visitors to all libraries
- 169 average volunteers each month
- Chart of new cardholders each month. October 2024 was the highest month with 40,000 new cards created when we imported student cards.
- 338,328 total cardholders in FY25
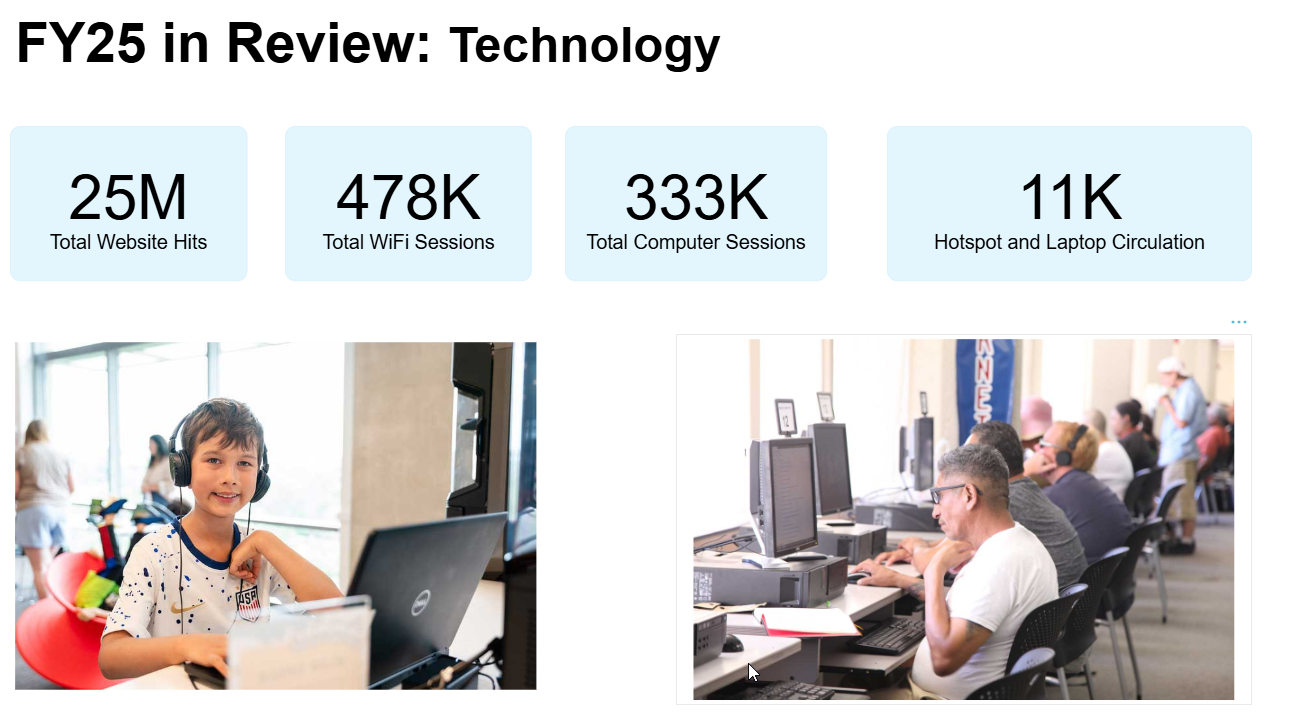
- Technology
- 25,000,000 website hits
- 478,000 WiFi sessions
- 333,000 computer sessions
- 11,000 checkouts of hotspots and laptops
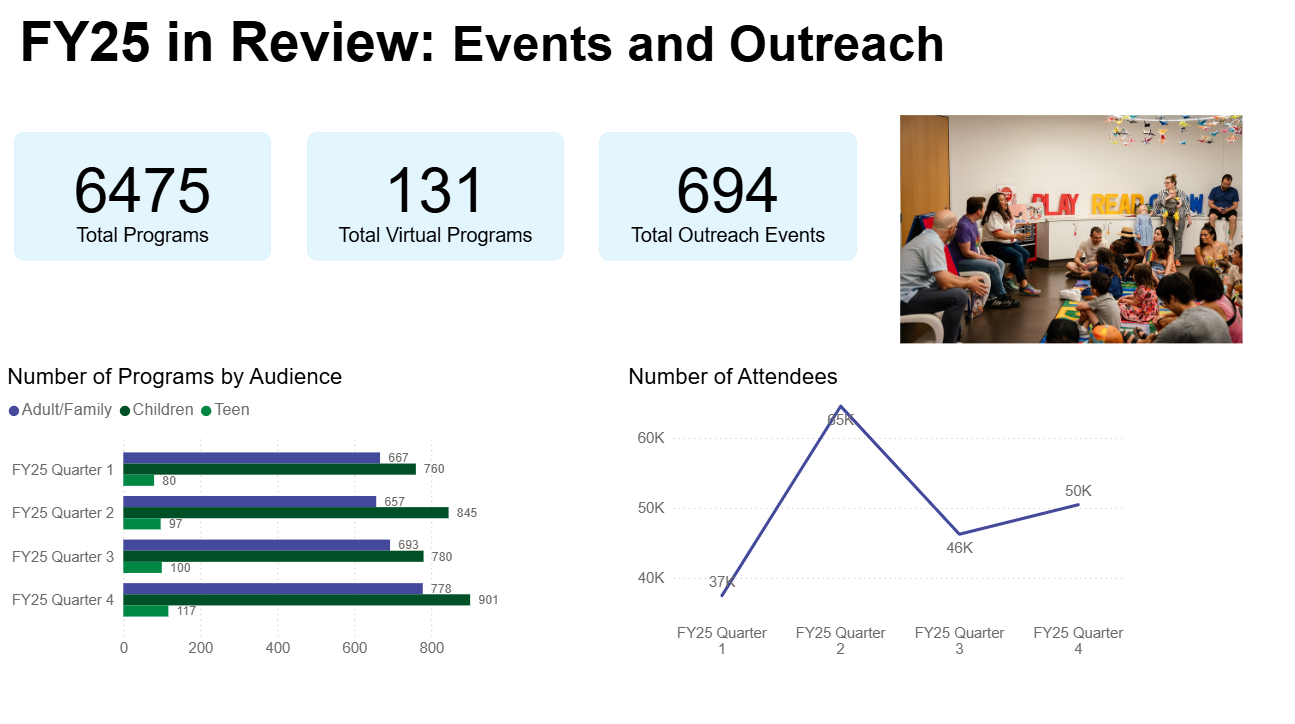
- Events and Outreach
- 6,475 programs in FY25
- 131 virtual programs
- 694 outreach events
- Chart of program attendance by audience. Children have the highest audience attendance overall, followed by adult then teens.
- Chart of the number of attendees by quarter. FY25 Quarter 1 attendance 37,000; Quarter 2 65,000; Quarter 3 46,000 and Quarter 4 50,000
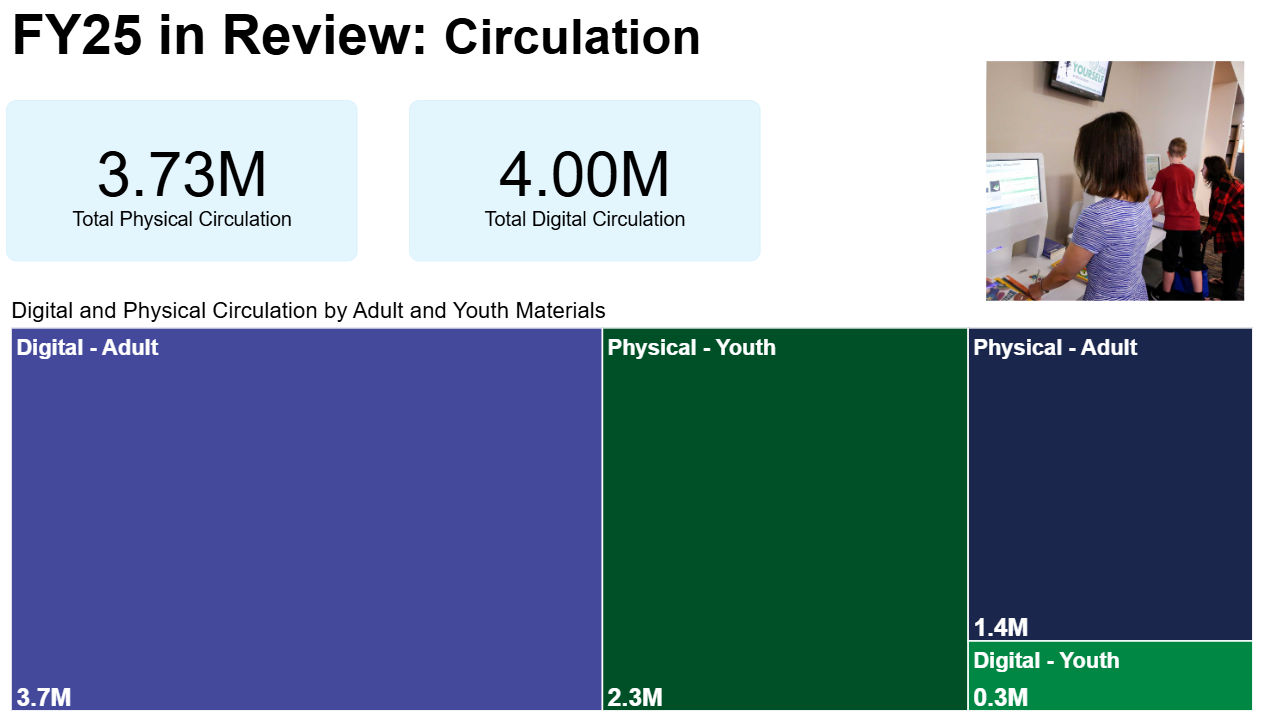
- Circulation
- 3,730,000 physcial items checked out
- 4,000,000 digital items checked out
- Heatmap comparing the digital and physical checkouts by adult or youth materials.
- Adult digital materials - 3,700,000
- Youth physical materials - 2,300,000
- Adult physical materials - 1,400,000
- Youth digital materials - 300,000
 Copy link to section